|
|
The physics of drying cloth |
By Kaisa Bengtsson, Kathrine Segel, Henrietta Havsteen-Mikkelsen and Tim Padfield
Drying cloth involves two processes. Energy has to be provided to change the water from liquid to vapour and an air stream is needed to remove the vapour. We discuss the two processes separately and then describe an experiment which demonstrates their relative importance.
Although everyone knows that waving a wet cloth in the air cools it down, the explanation for the phenomenon is not obvious, so we digress for a few paragraphs to explain why.
According to the kinetic theory, temperature is the expression of the average energy of molecular motion. The red curve in Figure 1 shows schematically the energy distribution of water molecules at 20°C (there is a more detailed explanation, and an accurate version of this diagram in the chapter The Preservation Index...). Only molecules with a high kinetic energy, towards the right hand end of the graph, will escape from the liquid water surface, against the cohesive force that binds the molecules in liquid water. As soon as this happens, the remaining molecules re-distribute their energy by collision, moving towards the blue curve, representing a lower temperature, because the average molecular energy is lower (indicated by the vertical dashed blue line).
Notice that the proportion of high energy molecules is much diminished, even though the temperature has only fallen five degrees. This means that the rate of evaporation will be much lower, giving time for heat to migrate into the wet cloth from the surrounding air or other materials touching the cloth. Eventually the temperature will stabilise at some value below ambient which depends on the balance between the rate at which the water molecules emerge from the surface and the rate at which heat can reach the cloth to re-invigorate the remaining molecules in the liquid.
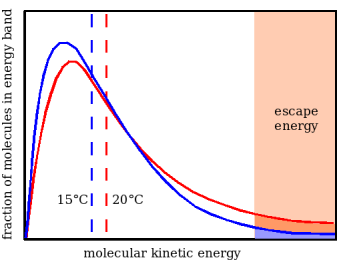
Figure 1. The kinetic energy distribution of water molecules at two temperatures, shown with exaggerated separation to clarify the explanation. As high energy molecules escape from the surface of water held in an absorbent cloth the remaining molecules re-equilibrate by collision, moving to the distribution shown by the blue curve. The cloth moves to a lower temperature, expressed by the average molecular energy (the dotted vertical line). There are now fewer high energy molecules and therefore a reduced evaporation rate. At some temperature the heat loss through evaporation is exactly compensated by heat gain from the surroundings, by convection, conduction or radiation.
In the simplest drying arrangement, the cloth is flapping freely in the breeze, with only air to bring the heat. This is called a psychrometer if one uses the temperature of the flapping cloth to measure relative humidity. The physics of this arrangement has been exhaustively investigated (see the discussion and reference on the page moisture calculations).
Figure 2 shows how the temperature and the water content of the air stream change as it passes over the cloth. This diagram is a portion of the vapour pressure diagram for water. The air in this example approaches the wet cloth at 20°C and at 46% relative humidity (RH). This is the apex where the three arrow lines meet. As the air passes over the surface of the freely suspended wet cloth it transfers heat to the cloth, moving down the temperature axis, and it gains water from the cloth, so it rises along the vertical, water content axis. The condition of the air moves to the head of the arrow at point A, because the air stream leaving the cloth is at 100% RH. This is true whatever the air speed. It also turns out that the point of intersection of the arrow with the saturation vapour pressure line does not move as the air speed changes, over a wide range of speed. This is why the psychrometer is such a simple and reliable way of measuring relative humidity. The wet cloth temperature is only affected by air pressure, because rarified air is not such a good carrier of heat, which, as explained above, is carried by molecular kinetic energy. The position of the 100% relative humidity line, however, is not affected by air pressure, because there is no interaction between air and water vapour molecules.
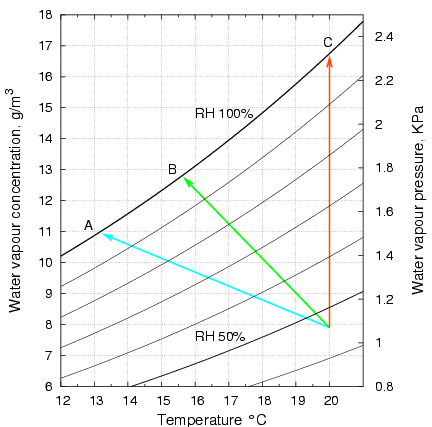
Figure 2. A portion of the vapour pressure diagram for water, showing curves of equal relative humidity. With heat for evaporation coming only from the air, the air passing over the cloth moves along the blue arrow to settle at 13.3°C, point A. In the experiments described below, the cloth was laid on a metal plate, which provided conductive heat from one side. The surface temperature then settled at 15.7°C, point B. In a further experiment, the metal support was held exactly at ambient temperature, so the air left the cloth at point C. Note that the air at C will be much more effective at removing moisture, because it can entrain water molecules at a concentration of nearly 17g/m3, instead of less than 13g/m3 at the lower temperature of the unheated plate. Furthermore, as figure 1 indicates, evaporation will be faster at the higher temperature.
One would expect the air flow rate to influence the drying rate. It has a very strong influence because the air leaving the surface is always at 100%RH, so much more water vapour is removed in a rapid air flow. One would expect a real gale to overwhelm the evaporative capacity of the cloth. It turns out, however, that the heat brought to the cloth by the air alone is sufficient to ensure evaporation of enough molecules to saturate the space above the cloth, at the lower temperature. The temperature doesn't change with wind speed but the evaporation rate does. Looking at the matter another way, the temperature dependent equilibrium between water at the cloth surface and vapour in the boundary layer of air is established very rapidly, compared with the rate at which the air stream can sweep the molecules away.
We want the cloth to dry quickly but we also want its 'dry' moisture content never to fall below the value in equilibrium with the ambient air, which means about 9% water content for cotton, for example. If the cloth temporarily loses water below this value, the cotton fibres will shrink temporarily. If they also slide past one another in the process, permanent shrinking or warping will occur. This is particularly acute with paper.
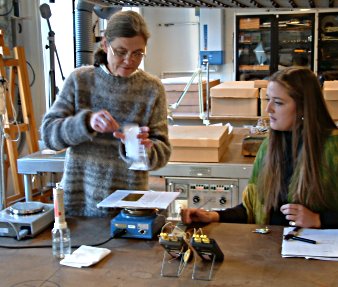 Kaisa (left) has just removed the damp cloth specimen from the warm plate and is putting it into a zip-lock PE bag for weighing. Henrietta notes the temperature of the cloth surface, using the two thermocouple digital thermometers in the foreground.
The easiest way to be sure that the cloth cannot over dry is to ensure that it never gets warmer than the ambient air, assuming that this air has the required moderate relative humidity. This is done by laying the cloth or paper on a heated surface, whose heat flow is adjusted exactly to compensate for the heat loss through evaporation, so the evaporating surface remains at ambient temperature. The air leaving the the cloth is at condition C in figure 2. The drying rate of this cloth is shown by the lowest, steepest black curve in figure 3.
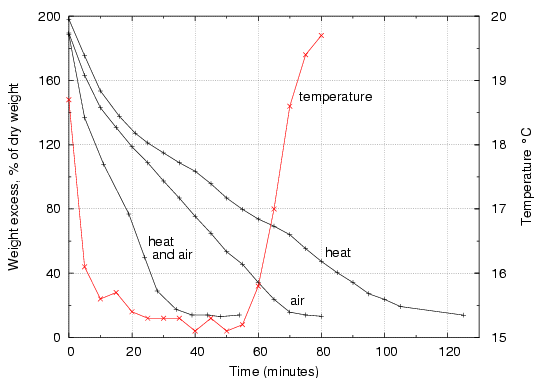
Figure 3. Drying rates for cotton cloth under various conditions. The top (black) curve is drying with heating from below so the surface remains at ambient temperature, but with no ventilation. The middle curve is for drying under ventilation at about 2m/s, but with no heating. The red curve shows the corresponding surface temperature attained by the cloth. The lowest black curve shows the rapid drying by applying both heat and ventilation, though the cloth never warmed above ambient temperature (20°C).
The highest curve, indicating the slowest drying rate, was obtained by heating the cloth to ambient temperature, with no deliberate air flow over it. The water vapour enters the boundary layer just above the cloth, but disperses very slowly into the room air. There is little convective air movement, because the temperature is the same as that of the room air (though the acute reader will remark that the saturated air near the surface is slightly less dense than the dryer air in the room). Drying is very slow, in spite of the heat energy supplied.
The middle curve is the drying rate when the cloth is ventilated at about 2m/s, with heat supplied mainly by the air stream. The temperature falls, as shown by the red temperature graph, so the cloth is behaving like an inefficient psychrometer, taking some heat by conduction from the metal plate which it rests on (the experimental arrangement is shown in figures 4 and 5). The drying rate is greater than in still air, implying that removal of the water vapour from just above the surface of the cloth is a very important accelerator of drying. The flat section of the temperature curve shows that water is evaporating at a constant rate almost until the end of the process, indicating that drying cloth mostly consists of removing free water from between the fibres. Only in the closing stages does the cotton release its internally bound water, at a decreasing rate. This is shown by the rise in temperature towards ambient, indicating a decreasing flow of energy needed to evaporate water, even though bound water requires more energy per molecule removed.
The lowest curve shows the fast drying when the cloth is both heated to ambient temperature and ventilated at about 2m/s. Whatever the ventilation rate, even the cotton fibres sticking up from the surface of the cloth will not be dried below equilibrium with the ambient RH, indeed they will dry more slowly, because they are further from the heat source below the cloth. The drying time is halved, compared with using ventilation alone, without any increased risk of mechanical stress in the fibre structure. If the ventilation rate is increased, the drying will speed up but there will be a greater temperature gradient through the thickness of the cotton, because more heat will have to be supplied to the evaporating surface. In the final stages this will lead to over drying of the cloth in contact with the metal plate. A more elaborate experiment, with a second thermocouple set on the metal surface, would define the practical limit to ventilation.
This simple experiment shows that ventilation is essential to drying and that heating just to ambient temperature will greatly accelerate drying. In practice, this is easy to automate. One need only drive a thermostat from a thin thermocouple lying just under the cloth, or ideally woven into it. This thermostat controls the current to a hotplate, which could be a low pressure table, as bought and under-used by many conservation studios.
Another interesting observation is that the greater part of the water is present as capillary water held between the fibres, indicated by the long straight sections of the drying curves, and by the long period of constant low temperature in the graph corresponding to the drying curve with ventilation alone. Only at the very end of each curve does drying of bound water within the fibre occur.
The rapid drying at the start of each run is probably an experimental artifact. The cloth may have left some water on the metal as it was removed for weighing during the first minutes of the experiment. The cloth could also have lost some water to the surrounding guard ring of cloth.
Psychrometry involves the properties of water and of air. It is important to remember that relative humidity is not a property of air, as a molecular mixture; it is a property of water vapour in space, influenced only by temperature. There is no chemical interaction between air molecules and water molecules. The air is acting merely as a transport agent: bringing heat to the cloth through transfer of vibrational molecular energy and mechanically sweeping water molecules away from the space immediately above the cloth. In the experiment where the cloth is heated to ambient, the air is no longer tranferring heat, which is defined as energy transferred across a temperature gradient. The air's only function in this case is to sweep away the water vapour molecules.
This experiment was done as part of a week long undergraduate course on practical experimental methods, at the Copenhagen Conservation School. We thank the staff of the school for lending various bits of equipment.
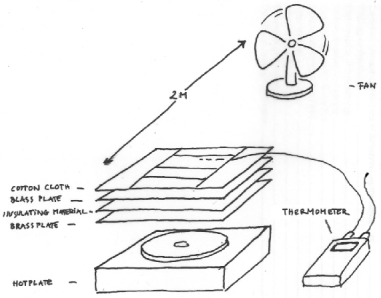
Figure 4. The experimental setup. The cloth is placed on a metal surface designed to spread the heat flow from the underlying, smaller, laboratory hotplate. The weighed portion of cloth is surrounded by a guard ring of cotton cloth which is also soaked at the beginning of each experimental run. The surface temperature of the cloth is measured by a fine thermocouple woven into the cloth. The heat flow from the hot plate is adjusted manually to hold the temperature exactly at ambient.
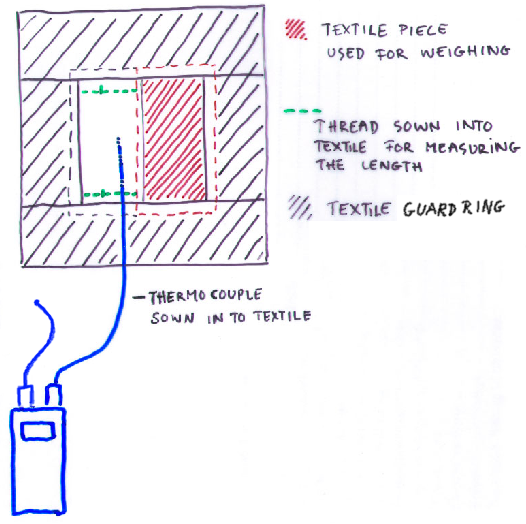
Figure 5. A view from the top, showing the rectangle of cloth, about 5 x 10 cm, which was weighed to measure the drying rate, surrounded by the guard ring of cloth, which was also saturated at the beginning of each run. The second rectangle in the middle held the thermocouple to measure surface temperature and was also used to measure the change in length of the cloth during drying.
The full report, with experimental details is in a pdf file.
Tim Padfield, December 2004

This work is licensed under a Creative Commons Attribution-Noncommercial-No Derivative Works 3.0 License.