The data for a year and a half shown in the previous section contains a confusing abundance of detail. There is, however, much worse to come, because we also measured many other climatic variables.
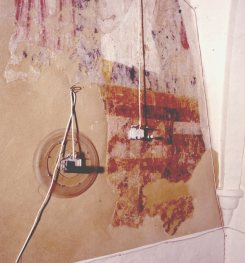 This picture shows one of the measuring sites, below the right hand figure painted on the choir wall seen in the previous section.
The white box hanging from a string and resting very delicately indeed against the painting, is measuring the surface temperature of the wall and the RH and temperature of the room air. The round device is a shallow acrylic cup, 20 cm diameter, with its opening against the wall. A silicone membrane gives a reasonable seal against the irregular plaster surface. The temperature and relative humidity are measured inside the container.
With this arrangement in place we waited patiently for the few short periods which would reveal how the building behaves climatically. Such revealing episodes are often caused by unusual behaviour of the weather, or of people. For one week the heating was left on. It was a long sermon, or a mistake, but the physics is the same.
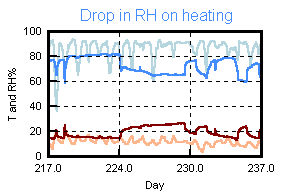 |
Here is a three week period. During the middle week the heating was continuously on. Notice how the inside RH (bright blue) varies in the opposite sense to the temperature (brown), as expected for the RH in a mass of air subjected to a varying temperature.
Click on all these graphs for a larger view, with the curves identified. |
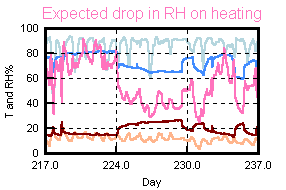 |
Here I have added the imaginary curve (purple) for the RH of outside air raised to the inside temperature. The calculated RH drop caused by heating is twice the measured drop
There must be a source of water in the church to keep the RH considerably higher than that achieved by warming air from outside to the inside temperature. One possibility is that the walls release water vapour, because all absorbent, porous materials release or absorb water according to the prevailing relative humidity, almost regardless of temperature.
|
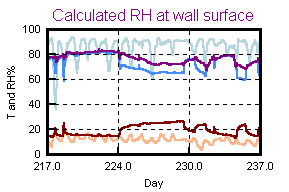 |
To test this hypothesis I have added the purple line, which is the calculated RH at the surface of the wall. This is obtained by taking the temperature and RH of the air in the church and calculating the water vapour content. This water vapour content and the wall temperature are then used to calculate a wall surface RH (6). Notice that there is no sudden jump in RH at the wall surface when the heating period starts. The RH gently descends, presumably as the water reserves in the surface layer of the wall are released into the air.
The wall appears therefore to be buffering the RH perfectly at the wall surface |
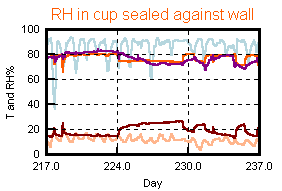 |
This hypothesis is supported by measuring the RH in the cup sealed against the wall (orange curve). The sensor, though close to the wall, is outside the boundary layer of cool air and yet cooler than the church air, because of the insulating value of the acrylic cup and the still air within the cup. The RH does therefore drop as the temperature rises but then remains steady, as one would expect because there is no loss of water from the enclosure. When the heating is turned down the RH in the cup bounces back immediately |
The poor insulation of church walls is therefore the main factor limiting the stability of the interior climate during heating episodes.
Part 3
Notes and References
6. The RH at the wall surface is impossible to measure directly, because the boundary layer of cold air is only about a millimetre thick and the RH sensor is both thicker than this and also of an area that would materially interfere with moisture transfer from the wall.

This work is licensed under a Creative Commons Attribution-Noncommercial-No Derivative Works 3.0 License.


 This picture shows one of the measuring sites, below the right hand figure painted on the choir wall seen in the previous section.
