 |
RH buffering by a mud wall |

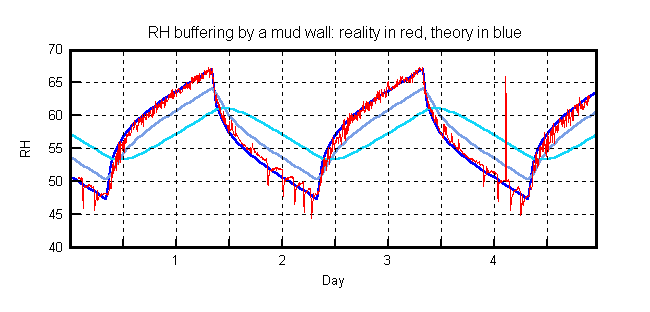
This graph is based on the same data as the figure in chapter 3. The mud wall is 0.5 square metres by 30 mm thick, exposed on one side. The chamber volume is about 0.5 cubic metre. The air conditioning was set to impose a square wave of flux of 0.5 g/hr into the surface for 24 hours, followed by an equal flux out of the surface for 24 hours. The temperature was 25°C. This flux would cause the relative humidity in an empty box to swing from 0 to 100%RH in 12 hours.
The graph shows that the actual RH swing was damped to 48-68% by the mud wall.
The shape of the RH curve is defined by three factors:
Diffusion through the surface of the mud.
Diffusion through the mud
Absorption within the mud
Diffusion through the surface depends on the air speed and the roughness of the surface. Diffusion through the mud is controlled by the porosity of the material. The water molecules struggling through this porous labyrinth are absorbed onto the clay particles. This last process is the buffering.
Each of these factors is represented by a constant in the diffusion calculation. This is not strictly true, but in the mild conditions of the experiment the approximation is close.
The red line is the measured RH, the dark blue line that nearly coincides with it is the modelled RH. The three factors described above have been adjusted by trial and error to give the best fit. The paler blue lines are the predicted RH at 5mm and at 15mm below the surface.
The most obvious thing about this graph is that the simplifying assumptions are justified. The agreement between reality and theory is as close as the experimental precision allows.
The fluctuation of the pale blue lines shows that the whole thickness of the mud is involved in the buffering process. The diffusion is quick enough. It is the small water capacity that is limiting the performance.
A thicker layer of mud will work much better. That is not too discouraging, because mud is cheap and is a structural material. Why not build the whole house of the stuff? We seem to have forgotten that one can build with earth even in wet and windy climates.
The internal RH in this mud wall is deduced from theory and needs to be tested experimentally (watch for updates). The need for experimental verification is dramatically illustrated by the performance of end grain wood, as described in the next chapter.

This work is licensed under a Creative Commons Attribution-Noncommercial-No Derivative Works 3.0 License.