 |
Stress, strain and craquelure - 3 |
The stress-strain diagram for a material is quite easy to make, experimentally. Similar diagrams can also be constructed for other "stresses" that cause a change in length of materials. Expansion due to rising temperature or to increasing relative humidity can also be described by a stress-strain diagram.
These various causes of expansion influence each other: many materials are more easily strained mechanically at high temperature and at high RH.
These stress-strain diagrams are an important reservoir of information that can be used, with caution, in more complicated situations where measurement is difficult. It is, therefore, worth taking time to master the jargon that you will encounter in the learned and tightly argued articles that must make you wonder, on a sunny afternoon, why you need bother at all.

The commonest stress-word that will be thrown at you from the page or the lecture stand is
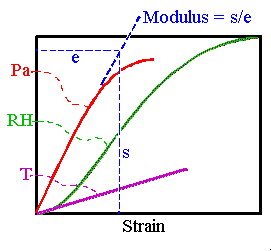
modulus, also called Young's modulus when referring to mechanical stress. This is the ratio of stress to strain, which is the slope of the curve in the diagram.The usual symbols are s for stress and e (extension) for strain. The modulus has the symbol E, so:
E = s/e. Since e is a ratio, the modulus has the same units as s: Pascal.
The modulus is a measure of the resistance to deformation. It is frequently called the stiffness, of a material. Be careful not to relax into thinking of stiffness in the everyday sense of the difficulty of breaking a cold chocolate bar with mittens during a ski tour, or stuffing dry spaghetti sticks into a small saucepan of boiling water. These problems are certainly related to the engineering concept of stiffness, because the difficulty of breaking the bar by bending is caused by the difficulty of extending one side and compressing the other. Glass fibre textile is also stiff, because it is resistant to stretching, even though it will drape easily in the hand. One must remember that stiffness, in the context of stress-strain discussions, usually refers strictly to pulling at things, or pushing at them.
Notice that the modulus is not necessarily constant with changing stress. The modulus for rubber, as sketched in part 1, is high at low stress, then diminishes at medium stress, finally becoming high again at high stress. The modulus may also change with humidity and temperature.
The concept of the modulus can also be used of the green curve in the diagram, with RH on the vertical (stress) axis. The strain, on the horizontal axis, is now the enlargement of the material caused by water absorption from the air, with no applied mechanical stress. At low RH the modulus is low, meaning that a small rise in RH causes a large increase in length. It rises for middle values of RH and then drops again for high values.
By analogy with mechanical stress, some authors describe the middle section with higher modulus as indicating an increased "stiffness" in the RH response in this region. This seems to me a misleading affectation. I would prefer the clumsier formulation: "diminished dimensional reaction to RH" in this middle range of RH. The use of stiffness in this context is confusing, because the RH also influences the mechanical stiffness (modulus) of nearly all organic materials. At low RH many materials show a higher mechanical stiffness but a lower RH "stiffness". If you find this confusing, I have made my point.
On to the next section: Using the stress strain diagram when there is no strain

This work is licensed under a Creative Commons Attribution-Noncommercial-No Derivative Works 3.0 License.