|
|
The interaction of water vapour with paper in small spaces |

Note: This is a draft chapter for a multi-author book on the conservation of paper.
All paper is enclosed to some extent, within the shell of the earth's atmosphere or by the tight embrace of a close fitting container. The main difference between these two extremes is that in the first case the earth's atmosphere defines the state of the paper, whereas in the second case the paper controls its local environment. This chapter is mainly about enclosures so small that the paper dominates its immediate environment. To anticipate later calculations, this means an enclosure with more than 100g of paper per cubic metre.
Understanding the climate within a small enclosure requires a firm grasp of some concepts in physics and an ability effortlessly to switch between different ways of expressing the amount of water vapour in space. These concepts are not part of the standard curriculum of science education, which is surprising, because an understanding of microclimate can enrich our everyday experience, and save us money, and maybe the planet, by allowing us to run our immediate environment more economically. However, my purpose here is more modest: to prepare the reader to judge the vast literature of advice on how to care for enclosed art. Some authorities advocate ventilation by cutting corners (literally), others warn of destruction by locked-in, aggressive chemicals. In this chapter I explain the interaction of paper with water vapour in pure air and in a confined space.
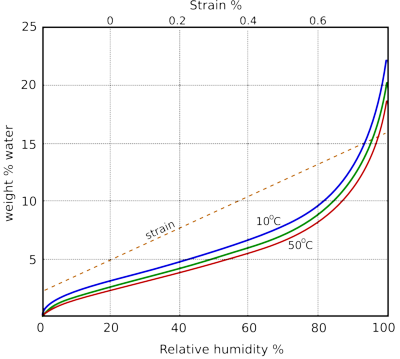
Figure 1: The water absorption of cotton cellulose as a function of relative humidity, after Urquhart [1]. The dotted line is the approximate dimensional change of paper as a function of water content. To use this dotted trace, follow the RH up to the water content curve, then sideways to the dotted line and up to the top x-axis to show the dimensional change relative to the size at 50% RH.
Paper interacts rapidly and reversibly with water vapour in the atmosphere. The amount of water absorbed is customarily plotted against the relative humidity of the surrounding space. The sorption curves for cellulose are shown in figure 1.
The absorbed water swells the fibres and increases their flexibility. For this mechanical reason, one regards a certain amount of absorbed water as a good thing. However, at a vastly slower rate the absorbed water reacts irreversibly with the paper, destroying its chemical structure. We have to accept that water is both necessary and destructive. Discussing how much water makes the best compromise between flexibility and endurance has long been a popular sport among environmental advisers [2].
Figure 1 is simplified because the course of the curve depends on whether the water content is increasing or decreasing. The difference is substantial if one starts with totally dry, or totally saturated paper, but for paper in a moderate microclimate without extensive swings in RH, the response is close to a single reversible line, somewhat flatter than the curves illustrated. This phenomenon is known as hysteresis. The difference between the wetting curve and the drying curve is not because the process has not reached equilibrium, it is a durable difference. The consequence is that paper can have a range of values of water content in equilibrium with a given relative humidity.
The dimensional change of paper with water content is not definable with the same precision as the water content, because the arrangement of the fibres affects the reaction to water absorption. The dotted line in figure 1 shows the typical change of size, expressed as strain, which is the change of size as a percentage of the original size.
There is an impressively large literature about the sorption of water on cellulose but there is unlikely to be anything special about cellulose in this regard, because almost all water absorbent materials, even non polymeric substances, have sorption curves of similar shape. The fundamental physics and chemistry of sorption on cellulose has been reviewed by Avramidis [3].
Notice that the sorption curves shown in figure 1 for different temperatures cluster close together. This insensitivity to temperature does not appear if one plots the water content against other measures of water vapour concentration than RH and suggests that the relative humidity is a peculiarly significant measure for the interaction of water with absorbent materials.
The potential of water to affect both the mechanical properties of paper and its rate of degradation is defined by the relative humidity (RH) of its environment. The relative humidity in a space is the actual water vapour concentration divided by the maximum possible water vapour concentration at the prevailing temperature. It seems strange, on first acquaintance, that such an indirect definition of concentration is used. Indeed, RH is not really a concentration unit at all, it is merely a ratio, a number. One can only work out the concentration of water vapour molecules in the space if the temperature also is cited. One is tempted to use the simpler, direct measure of concentration: kilograms of water molecules per cubic metre. It turns out, however, that the RH is the best measure of the potential of water to make things happen: to absorb onto a cellulose molecule, to enter into a chemical reaction and to support living processes [4]. The identity of relative humidity and the chemical activity of water (which is usually expressed as a fraction rather than a percent) is proved in thermodynamic textbooks and in textbooks on plant physiology [5]. Note that the water concentration, in kg/m3 can be very different in two phases with identical RH and therefore with identical water activity. For example the RH in equilibrium with a saturated sodium chloride solution is 75%, yet the concentration of water in the saturated solution and in the air above it is very different: in the solution it is about 800kg/m3 but in the air it is about 13 g/m3. Yet the chemical potency of water in the two environments is identical. But in the brine soaked paper the capillary spaces between the paper fibres will be filled and the salt ions also interact with the cellulose molecule, so the identity of RH and water activity must not be blindly assumed to establish identical states of the complicated multiphase substance that is paper.
Although the relative humidity best describes the tendency of water to absorb into paper fibres, the water vapour concentration, expressed in kg/m3, has a role in describing the movement of water vapour into the paper web. It is the concentration of molecules in space that is the driving force for water vapour moving through porous materials. At a uniform temperature, there is no difference between RH and concentration as driving forces: the two units are proportional so it doesn't matter which one uses. There are yet other ways of defining water vapour concentration: in dynamic studies of water movement through porous materials, researchers customarily use the partial water vapour pressure, measured in Pascal, as a concentration. The Pascal is a force of one Newton per square metre. Atmospheric pressure is about 100,000 Pa. At constant temperature, the vapour pressure is proportional to the concentration in kg/m3, so all three measures of water content are equivalent, though one must be careful to get the proportionality constants right. The reader has to be familiar with all these ways of expressing water concentration in order to follow the intricate arguments in the scientific literature about how paper interacts with water vapour. The connections between these various measures of water concentration are summarised in figure 2. The various units, definitions and concepts that are used in scientific papers on water sorption are systematically described by Kumaran [6].
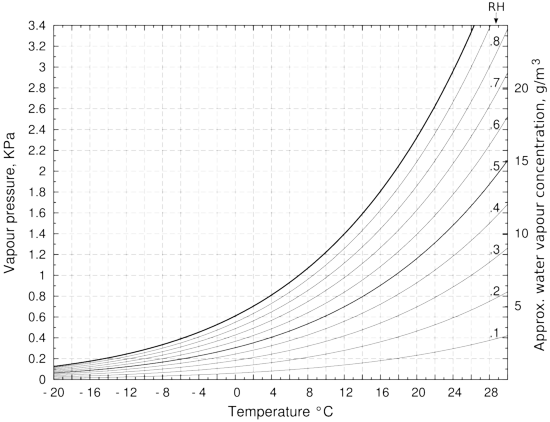
Figure 2: The vapour pressure over water, with lines of relative humidity (RH). The approximate water vapour concentration on the right hand vertical axis is only correct for the saturation vapour pressure line. This is because of the expansion with temperature of water vapour at constant pressure. If the container is sealed, which is seldom the case in practice, the right vertical axis value is correct over the whole diagram. The vapour pressure is calculated using Tetens' formula. [13]
The need to be able to think both in terms of relative humidity and in kg/m3 becomes apparent as soon as one considers what happens when there is a temperature gradient across a container. So far we have considered only the situation where the temperature is uniform and constant. When the temperature is not uniform, the water vapour concentration expressed in kg/m3 tends to remain uniform throughout a confined space, being only slightly affected by a temperature gradient. The local concentration will diminish by about one part in 300 for every degree increase in temperature.
The effect of temperature change on the saturation vapour pressure of water is, however, much greater: a change from 20 to 21 degrees causes an increase from 2326 to 2473 Pa, an increase of one part in 16, about twenty times the change caused by thermal expansion alone. In a container containing only humid air, the RH will decrease as the temperature rises. A ten degree cooling from 20°C of a container initially at 50% RH will cause the RH to rise to 95%, as can be seen by tracing horizontally in figure 2 from 50% at 20°C to 95% at 10°C. Imagine now that the container is a picture frame with a water vapour content of 8.6g/m3 (corresponding to 50% RH at 20°C). Now fasten it against a cold wall at 10°C but with the front glass still at 20°C. Suppose now that one glues one very thin piece of paper to the inside surface of the (impermeable) back of the frame and another thin piece of paper to the inside of the front glass. Very soon the paper at the back will be at equilibrium with 95%RH while the paper at the front will be at 50%RH. The RH values will in fact be slightly different because of the water capacity of the paper but the general picture is correct. The cold paper will eventually show mould growth, in the same container that has healthy paper on the warm side. The RH difference, and the consequent difference in water content of the two pieces of paper, will be constant and stable, as long as the temperature difference endures. There will be no water movement from the cold paper at 95%RH to the the warm paper at 50%RH because the water vapour concentration is stable throughout the enclosure.
The paradox of a nearly uniform water molecule distribution coexisting with a gradient in relative humidity wherever there is a temperature gradient is the cause of many phenomena that alarm conservators. Any mention of mould growth in the corner of a room can usually be attributed to the corner being colder than the rest of the room. There is no need to assume a local source of water vapour, though a low corner in a porous outer wall may also be a local source of water. Uneven water vapour concentration in a room is unusual. Convective mixing of air, even in a room with no humanly detectable draught, is very fast, leading to uniformity within twenty minutes of a disturbance. Mould in enclosed spaces in a room is also asserted as evidence for the importance of ventilation in preventing mould growth. Yet there is no evidence at all that air speed affects the growth of microorganisms (there is little evidence against either; it is a neglected subject in biochemistry). The likely explanation is that slow air flow is allowing the enclosed space to stay cooler. In heated buildings it is air movement that plays the major role in ensuring an even temperature throughout the building. Enclosing paper in a container has no effect on its susceptibility to mould growth, on account of the reduced air speed over the surface, but temperature gradients in enclosures can cause locally high RH with consequent mould growth, as will be explained in greater detail later.
Conservators are usually exposed to the information about moist air shown in figure 2 in the alternative form of the psychrometric chart, which looks very similar but is actually constructed completely differently, and for the benefit of another group of people: air conditioning engineers [7]. They are concerned with the energy changes associated with evaporating water into air, and with air as a transporter of heat and of relative humidity through ducts that distribute conditioned air throughout the building. On the psychrometric chart, the water vapour concentration is expressed as the humidity ratio: kg of water per kg of dry air, at a specified total air pressure.
The psychrometric chart injects some confusion into understanding moisture in air, because the curves of relative humidity are associated with a Y-axis marked as water content in kg/kg of dry air. However, air plays no role in the definition, or the effects, of relative humidity. There is no chemical interaction between air molecules and water vapour in the air. Do not think of water vapour as dissolving in air. The independence of mixed gases was first asserted by John Dalton in his law of partial pressures, from 1801. That does not stop everyone nowadays talking about the relative humidity of air. We should properly refer to the relative humidity in space, but that seems too pedantic. This formal error hardly matters, until one tries to understand what happens in a leaky enclosure during transport through the stratosphere.
Continuing the theme of misunderstood concepts, the use of water vapour pressure as a measure of concentration leads people to imagine water vapour forcing its way through a porous material to wreak all sorts of havoc. The correct, but pedantic, expression partial water vapour pressure clarifies that water contributes just a small part to the total air pressure, which is largely contributed by oxygen and nitrogen. Then it becomes understandable that water molecules merely diffuse through porous materials in a random walk (at about 400 m/s) but do not stream through under their own vapour pressure (though they certainly stream through under a difference in total pressure across a wall). If the local partial vapour pressure of water vapour increases, as it does when one sips a cup of steaming hot coffee, then oxygen and nitrogen molecules have to move away to give room for the new water molecules, so that the total air pressure remains the same. A surprising consequence of the law of partial pressures and of Avogadro's hypothesis of 1811 (that equal volumes of gas contain equal numbers of molecules), is that humid air is less dense than dry air, since the water molecule has a weight of 18 units compared with 28 for nitrogen and 32 for oxygen. Desiccators for drying materials in laboratory experiments have the desiccant in the bottom, which is quite wrong - because the dry air next to the desiccant is gravitationally stable and stays below the wet specimen. The drying agent should be at the top. Tradition trumps rational design, even in science laboratories.
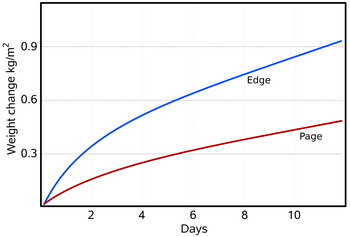
Figure 3: The water absorbed and desorbed by a typical book, 30 x 150 x 230 mm, with plastic covers. The 'edge' curve is the desorption when the closed book, previously equilibrated to 76% RH, was put into a container with anhydrous calcium chloride (close to zero percent RH). The book was then oven dried to equilibrium with 5%RH and put into a container at 76%RH (provided by saturated sodium chloride solution). The front cover was cut off so the first page was exposed, but the edges were covered with impermeable plastic. The rate of water movement through the edges is about double the rate through the flat lying paper fibres of the page. The total exchangeable water over this RH range is about 0.08 kg/kg of dry paper, which corresponds to about 1.37 kg/m2, so the book, with just the first page exposed, takes about eighteen days to come half way to the final equilibrium with the water vapour in the unventilated and unstirred container. Compare this simple experiment with the computer simulation of a similar situation shown in figure 4.
Although a single piece of paper will come substantially to equilibrium with the surrounding space within a minute or two, the movement of water vapour through a stack of paper is much slower, a typical book taking about a week to come half way to equilibrium with its surroundings (figure 3). When water vapour moves into a pile of paper it has first to diffuse across the boundary between the air space and the surface of the paper. In most situations, this process is much faster than the further movement of water molecules through the stack of paper. The rate of transmission through the surface is, however, controversial. The rate of diffusion of water molecules through the boundary layer of air at the surface of absorbent materials has been reviewed by Wadsø [8]. An approximate value of this rate is 5 x 10⁻⁸ kg/(m2.s.Pa). Let us put some numbers to this. A square metre of perfectly dry paper suddenly exposed to 50%RH at 20°C has a partial vapour pressure difference between it and the space around it of 1116Pa. Over one hour, 200 grams of water will move into the paper from the space around it.
The diffusion of water vapour further down into a stack of paper is believed, at moderate RH, to occur mainly by diffusion through the labyrinth of air spaces. As the water vapour moves into the stack, some is sorbed onto the fibre surfaces. Since the surface sorption rate is fast, one assumes that the fibres are always at equilibrium with the momentary RH of their adjacent air space. As the water vapour moves deeper into the paper its concentration will decrease, as it is partly lost to the surrounding fibres. The fibres are not believed to transmit water molecules between themselves at a significant rate [9]. One can consider the fibre as a water receptacle that is a dead end: it absorbs and desorbs water into the capillary air space next to it within the paper but the further movement of the water molecules is almost entirely through the air channels.
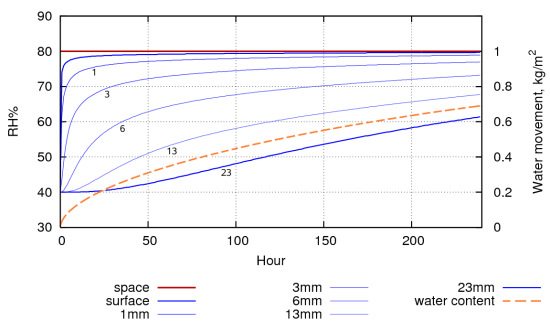
Figure 4: A computer simulation of the evolution of the RH within the pore spaces of a stack of paper, 30mm high, conditioned to 40%RH, with only the top exposed to 80% RH. The water movement through the surface is shown by the dashed line. The total exchangeable water is 1.026 kg. The half time to equilibrium is about 5 days. This compares with approximately 20 days for the book (figure 3).
Since water is being lost to the fibres as it penetrates the stack, the driving force for water vapour movement to penetrate further is steadily diminishing. Likewise, the water absorbed in the surface layers will reduce the potential driving water into the surface. Figure 3 shows the gain in weight of a book as water vapour diffuses into it under a starting potential of 1768 Pa. At first the change in weight is rapid but it falls away as the surface comes close to equilibrium with the space above, and thus reduces the driving potential. The inhomogeneity of paper is evident: diffusion through the edges is faster than through the surface, with its flattened mat of fibres impeding diffusion. The distribution of water through the stack is difficult to measure without interfering with the structure of the paper mass. It can, however, be approximately predicted by a finite element calculation (also called a control volume calculation in the literature). It works like this: one divides the paper stack into thin slices and treats each slice as a homogeneous water reservoir which gains water from the slice nearer the surface, absorbs some water into itself and passes the residue on to the next slice. The imaginary water vapour diffusion is only allowed to continue for a second or two, to avoid flooding a slice to an unrealistic degree. The calculation repeatedly cascades down from slice to slice. It uses as its constants the water capacity per % change of RH from figure 1, the density of the paper, which is typically about 570 kg/m3, and the diffusion coefficient, which is the rate at which water vapour diffuses through a stack of paper of unit thickness under a water vapour pressure difference of one Pascal.
The diffusion coefficient of different papers is quite variable. It is not practical to measure it for many particular papers in museum collections; the book paper of figure 3 has not been measured. The coefficient is usually measured by covering a cup with a stack of paper, sealed round the edge. The cup has a fixed internal RH, usually defined by a saturated salt solution, and is placed in an air stream of different, but constant RH. The cup, with its paper cap, is weighed at intervals and the rate of weight change is measured when it has reached a steady value. In this way one measures the rate of water vapour transmission through the stack for a given RH difference, which is customarily translated into a vapour pressure difference. In this experiment there is no movement of water into or out of the fibres when the steady rate has been attained, so the diffusion coefficient thus measured is really just the diffusion through the air channels. There are other ways of mathematically extracting the diffusion coefficient from a non-steady state experiment, but these are less often used. The steady state diffusion coefficient is a reasonable approximation, if one is sure of the relatively very fast equilibrium between paper fibres and the air spaces. This has been investigated by Gupta and Chatterjee [9] in some detail, so we can assume that the simple model of diffusion described above is adequate to describe, and to some extent predict, the phenomena of concern to conservators.
Let's put some numbers in. Consider a stack of paper, one square metre in area and 0.1 m high, with a relative humidity in the space above at 80% and the RH at the base of the stack held continuously at 50%. The temperature is 20°C. The water vapour pressure above is 1861Pa, below is 1163Pa. The difference is about 700 Pa and the gradient is 700/0.1 = 7000 Pa/m
A typical diffusion coefficient is around 20 x 10-12kg/(m.s.Pa). Notice the change of unit compared with the diffusion coefficient across the boundary layer. This is because the boundary layer is of unknown thickness, but here we are concerned with the rate of flow through a defined thickness of paper. The water flux in kg/s through any plane within the stack of paper and parallel to the surface will be 20 x 10-12 x 7000 kg/(m2.s) which is about one gram every 2 hours.
These two calculations show that the rate of movement of water vapour into the surface of the paper is much faster than the subsequent movement through the paper, given the moderate vapour pressure gradient through the stack.
Figure 4 shows a simulation of water absorption into a stack of paper, 30mm high, resting on an impermeable surface, first conditioned to 40%RH and then exposed to 80%RH. It takes about 5 days for the middle of the paper stack to come half way towards the new equilibrium. A more realistic stress for paper is the daily RH cycle in rooms without climate control. Figure 5 shows the response of paper, preconditioned to 60%RH, to a daily RH cycle. The grey curve at the bottom integrates the water content of each layer to show how much water has exchanged with the surrounding air.
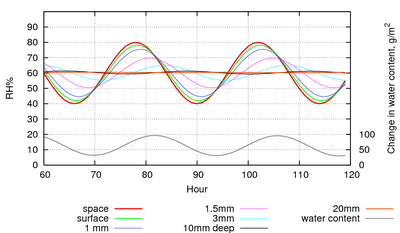
Figure 5: The evolution of the RH within the pore spaces of a stack of paper, 1 m2 in area and 20cm high with only the top exposed to a sinusoidal RH with a 24 hour cycle. The lowest trace shows the change in water content, summed over all the layers of paper. This shows the amount of water vapour exchanged with the space above the paper stack.
Figure 5 shows the reaction of paper to overwhelming power, in the sense that the RH cycle is imposed so that the water exchanged with the paper cannot influence the RH. This is the situation in an air conditioned room. Notice that the square metre of paper in the figure is exchanging about 60g of water with the room on every cycle. This is the amount of water that would bring a 10m3 space from zero to 40%RH, so the air conditioning has to do some work to cope with the water flux from the paper.
If the paper is enclosed in a leaky container which is set in the same cyclic climate, the water exchanged will buffer the RH in the container so that the amplitude is much reduced. Figure 6 shows the same room RH cycle as in figure 5, but with the paper enclosed in a case of 2m3 and with a leak rate of one volume every 2 hours. The RH in the case only varies by 20% peak to peak, instead of 40% in the room.
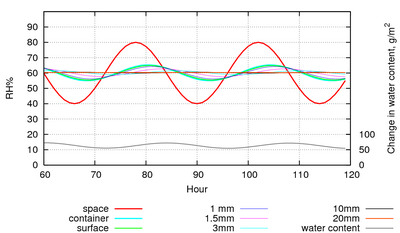
Figure 6: The RH within a leaky container, with an air exchange rate of once every two hours. The RH cycle amplitude is reduced to a quarter by the buffering effect of the paper.
Note also that in this daily cycle only the top 3mm of the paper is involved, below that level the RH hardly changes.
In a confined space, the water content of paper controls the RH of the surrounding space. This phenomenon is known as humidity buffering. The amount of exchangeable water in the paper is vastly greater than the water vapour content of the enclosure. Consider a picture frame 30 x 50 cm and 3cm deep. The volume is 0.0045 cubic metres. At 50% RH the water vapour content is 0.0086 x 0.0045 = 0.04g. If the frame contains 200g of cellulosic material in the form of paper and its supporting backboard and framing mat, its water content will be about 6% of the dry weight, that is 12g of water, 300 times the amount of water in the air around it. If the air is suddenly replaced by completely dry air, the paper will immediately supply the 0.04g required to restore the RH to very nearly 50%, while its own water content is diminished to 11.96g, which is still in equilibrium with a RH very close to 50%.
There is an entirely different buffering process which comes into play when the temperature of the enclosure changes uniformly. If the temperature falls from 20°C to 10°C the RH in an empty container intially at 50% RH would rise to 95%, according to a finger tracing horizontally in figure 2 from the intersection of the temperature with the 50% RH curve to hover vertically above the lower temperature and close to the saturation line. However, with paper in the space, the RH will actually fall slightly. The previous paragraph demonstrated that it is the water content of the paper that decides the RH of the surrounding space, which it is able to regulate with hardly any change in its own water content. A constant water content is represented by a horizontal line on the graph in figure 1. Moving horizontally from the high temperature curve to the low temperature curve corresponds to a small but significant decrease in equilibrium RH, for the same paper water content. The effect of the fall in temperature is to reduce the equilibrium RH by about 3% for a ten degree drop in temperature, so the RH in the enclosure drops to 47%, in strong contrast to the near saturation in the empty enclosure.
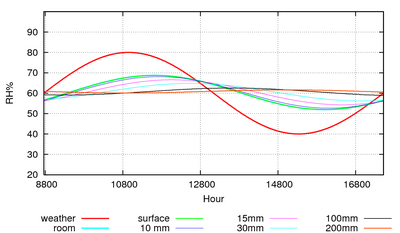
Figure 7: The predicted course of the climate over a year in a storage room with an air exchange rate of once every ten hours.
Humidity buffering by paper happens naturally in archives and can replace mechanical control of relative humidity if the building is designed for this purpose [10]. Figure 7 shows the predicted course of the relative humidity in an archive with a mere one square metre of paper per cubic metre exposed to the room air. The room has an air exchange rate of once every ten hours, which is easily attainable in practice. The annual cycle of RH has been halved. Note that the annual cycle of RH penetrates 200mm down into the paper stack. I advise against relying on computer predictions. Fortunately, there is a climate record, figure 8, from the state archive of Schleswig, Germany, which confirms the good performance of an archive without mechanical air conditioning.
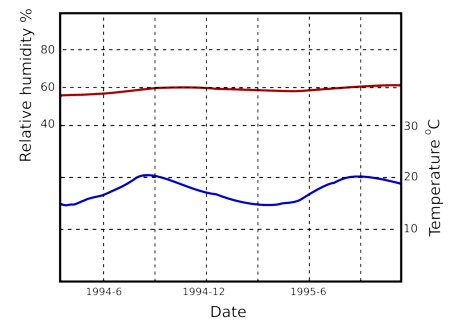
Figure 8: The course of the climate over a year and a half in a storage room of the Schleswig State Archive in north Germany [11].
Conservators often remark that it is unethical to use valuable paper objects to buffer their own environment. This is setting human value judgements up against the chilly impartiality of natural laws. Environmental processes treat all paper as equal, even if one piece has the ink marks made by Mozart's quill. Paper will continually move towards equilibrium with the surrounding RH, however that RH is controlled. The equilibrium is dynamic, meaning that one particular water molecule will not be glued in place on the same cellulose molecule for a century, even if the RH is perfectly stable. The weakly bonded water molecules which are within paper at 50%RH have a short residence time at their sorption site. If one drags water vapour out of a room with powerful mechanical air conditioning, the paper will release moisture to come to a new equilibrium, as set by the air conditioning equipment. If the force changing the RH is weak, such as a slow leak of room air into a small container filled with paper, the water released by the paper will linger around in the container, reducing the RH change and thus reducing the dimensional change that is a consequence of water gain or loss. The fact that the moisture has come from the valuable paper does not diminish the advantage that the paper has lost less water than if it were exposed to the more variable climate outside its immediate enclosure. One can argue that self buffering is desirable in archives, because mechanical air conditioning cannot achieve as good RH stability as an enclosure full of paper. Mechanical systems rely on a sensor sending back the RH error from the set point. The mechanical system reacts to this, usually overshooting the mark. Modern air conditioning may have `proportional control' which causes the humidifier to shut down just before the set point is attained but in practice mechanical air conditioning at its best always causes some small fluctuation. The cultural value of the papers has no effect on their surrounding climate so one might as well save space by clustering all the valuable stuff together instead of buffering a few unique treasures with piles of newspaper. The climate will be the same and the movement of water to and from the paper will be the same. Some materials marketed as humidity buffers have sorption characteristics with a different temperature sensitivity to those of paper, so a temperature change will cause water to transfer between the buffer and the treasure it is supposed to be guarding. In most cases, expensive humidity buffers give no advantage at all and one popular buffer contains a deliquescent lithium salt which will cause much trouble if it escapes. To summarise: archives and stores should be designed to rely largely on humidity buffering by the archived material. It is astonishing that this elementary truth, so easily demonstrated, is not universally realised, nor incorporated into current standards for archival storage.
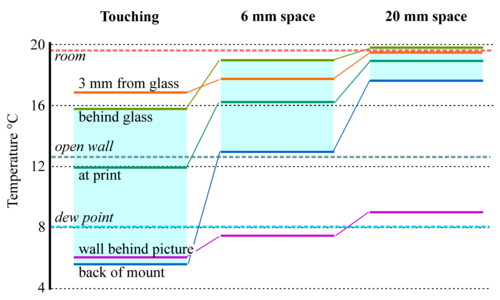
Figure 9: The temperatures measured at various points around and within a print framed behind glass (about 300 x 200mm) and mounted close against a cold wall. Separation of the frame from the wall greatly improves the temperature uniformity within the enclosure. [12]
The humidity stabilising process ensures that enclosed paper enjoys, in fact asserts, a very constant RH in its surroundings, even when the temperature varies by many degrees. The stability against temperature change only applies when the temperature is uniform throughout the enclosure. Suppose, for example, that one puts a lot of card behind a thin paper print, partly to provide a humidity buffer. The card is carefully preconditioned to 50%RH. At first the assembly, in its airtight container, is uniformly at 20°C. According to the diagram, figure 2, the moisture content of the trapped air is 8.6g/m3. Now the picture frame is put against a cold wall so the card cools to 10°C. From figure 1 one can estimate that the equilibrium RH has reduced to about 47%RH. Remember that the card contains nearly all the water in the system, so it is the card that controls the local RH. The water content of the space adjacent to the card will be reduced to a mere 4.4g/m3. The card has withdrawn water from the space within the frame as it cooled.
The print, however, is lit by display lamps and is still at 20°C. The air around it now has the same diminished water vapour content as the air close to the cool card, because the water vapour concentration has become nearly uniform throughout the enclosure. This new concentration corresponds to 25%RH at 20°C. The print will now lose water to the air to come to equilibrium with the new low RH. This water is nearly immediately absorbed by the relatively abundant cellulose in the card, so the final RH around the print will be around 27%. The card put in to stabilise the RH has in fact destabilised the RH around the print, which is at a different temperature.
Here is an important rule: moisture buffering by absorbent materials only works in an environment at uniform temperature. If there is a temperature gradient, the buffering process positively endangers the paper within the space. This is a good reason for not adding masses of humidity buffering to objects being prepared for transport. What is needed is thermal insulation to minimise temperature gradients, then the object will look after itself. If the journey is long, so you need to guard against leakage as well as temperature change, make sure that the buffer is placed so it is always close to the temperature of the protected object. This usually means keeping it physically very close to the object. So don't use absorbent boxes outside thermal insulation when transporting paper.
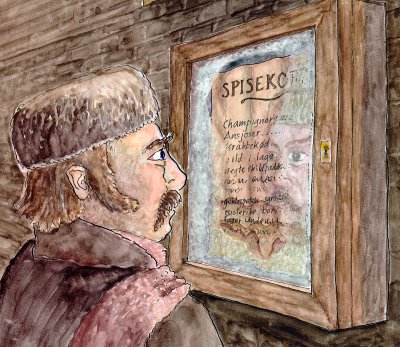
Figure 10: The warm wall evaporates water from the paper of the menu, which condenses on the cold glass, runs down and is re-absorbed by the paper. Because the sides of the enclosure are also exposed to the cold, condensation is worse towards the edge of the glass, obscuring the price while revealing the culinary delights on offer to the hungry traveller.
If the temperature difference is more than about 10°C and most of the paper is huddled against the warm side, there will be condensation on the cold side of the enclosure. If there is no paper on the cold side to absorb the condensation there is a good probability that another sort of physics will come into play: the action of gravity. The process is well illustrated by restaurant menus in winter, as shown in figure 10. The paper is against the warm wall, so condensation occurs on the glass facing the reader. The condensation dribbles down and then is sucked up by capillarity in the paper, sweeping dirt and degradation products into a sharp tide line at the point where the liquid water re-evaporates to continue the distillation cycle.
This damage can be prevented by raising the menu so it is separated from the floor of the enclosure by a hydrophobic space. Pinning it to the back rather than just placing it in the frame would be a good first step.
Temperature gradients are rarer in well-ordered museums but there are two common sources of temperature gradient. The most obvious one is in framed pictures mounted against outer walls. Figure 9 shows how the temperature gradient through a framed picture can be diminished simply by moving it away from the wall by a centimetre or two, depending on its size, to allow room air to circulate behind it. Insulation at the back of the picture would certainly help, but also make the assembly more bulky. An air space is an adequate solution for a small picture.
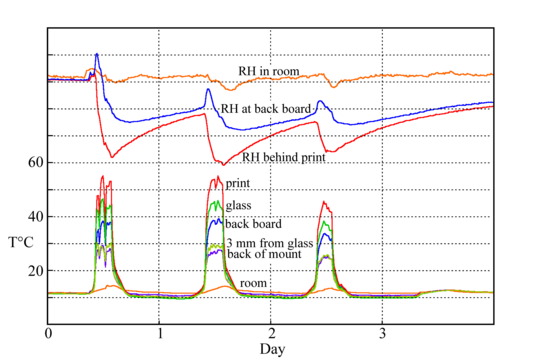
Figure 11: The temperatures measured at various points around and within a print framed behind glass and exposed behind a south facing window. The print reached over 50°C, more than sufficient to cause condensation on other surfaces within the enclosure. [12]
Sunlight is another common cause of a temperature gradient in a picture exposed in a gallery. The heating effect of sunlight, even through a window and then through the picture glass, is enough to raise the temperature of a dark coloured object over 50°C (figure 11). This is well above the temperature needed to ensure condensation on any part of the assembly which is near room temperature. Such cool parts include the glass in front of the picture. This is because the infra-red radiation absorbed by glass has already been taken by the window, so the glass in front of the paper absorbs no solar radiation and stays cool.
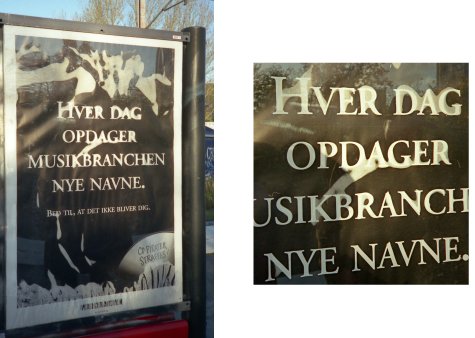
Figure 12: Condensation on the glass in front of a dark print warmed by the sun. The glass in front of the dark areas is warmed by re-radiation from the dark pigment. The glass in front of the white text is cooler, so it is there the water evaporated from the paper condenses.
Radiation heating is very uneven when the surface colour varies. So there can be considerable lateral movement of water between parts of a picture and also localised condensation on the glass of the frame. This is a likely, but not universal, cause of the commonly observed transfer of the pattern of a picture to the glass in front of it. The images may be in many chemical forms, but the driving force that puts them there may well be the local temperature differences between the light absorbent picture and the cooler glass.
The subtlety of these phenomena is hinted at in figure 12. This picture was taken in a low winter sun, which warmed the dark areas of the paper, evaporating water into the adjacent space. The water condensed on the glass in front of the white areas, which were cooler, so the glass also was cooler.
I warned earlier about the dire consequences of getting accustomed to definitions that are not strictly correct. When a piece of paper in a leaky container is raised into the stratosphere in the belly of an aircraft, air, with water vapour, will leave the container. The relative humidity will fall, even though the water vapour to air ratio, in kg/kg, remains constant. This is because the water vapour concentration has diminished, even though its ratio to air molecules remains the same. The paper will soon re-establish the original RH in the container, or very close to it, because it has such a massive moisture reserve. The data logger packed with the object will register a sudden drop in RH followed by a nearly complete recovery. On descending, air rushes in to the case, but this will be alien air, of unpredictable water content. The datalogger will again record a RH blip, which will always be upward, because however low the RH of the incoming air, it will still contain some water vapour, which will add to the pre-existing water vapour in the container and thus will raise the RH. Again, the paper will re-assert its command of the situation by absorbing water to restore the equilibrium. The amount of water involved and the RH disturbance is small, so it is better to make the case leaky because the consequence of pressure on an airtight case could be much more damaging.
The arguments laid out in this chapter predict that enclosure of paper in an airtight container very much stabilises the water content of the paper, providing there is no temperature gradient within the enclosure. Temperature variation will occur during transport, on hanging the enclosure against an outside wall or through exposing a glazed container to a powerful radiation source, notably sunlight. When a thermal gradient is applied, buffered enclosures generate a more extreme microclimate than would be generated around freely exposed paper. Enclosure must be accompanied by temperature uniformity. Thermal mass, and thermal insulation are more important than buffer capacity for short term stability.
The only argument against airtight enclosure of paper in storage or display is the risk of chemical degradation from volatile chemicals generated within the paper, which otherwise would diffuse out to be removed by the room ventilation. Diffusion through a mass of paper, even of the small water molecule, is a slow process, so a measure of self-containment is already present in an ordinary book exposed in a room. Nevertheless, it is commonly observed that books decay from the outside in, suggesting that self harm has in the past been rarer than damage from pollutants in the wider environment. That is changing now and the slow decomposition of nitrocellulose in book covers, for example, is a real threat to paper. The conservator must always be ready to segregate unstable materials.
The computer simulations were made with a Python program. This zipped file contains all the necessary files including an example file of runtime parameters. The Python interpreter is a standard component of mac OSX and linux operating systems. For MSWindows it can be downloaded free from python.org.

This work is licensed under a Creative Commons Attribution-Noncommercial-No Derivative Works 3.0 License.